Linux bootup performance Graph !
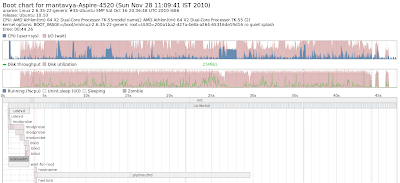
Bootchart is the great tool to graph the system bootup performance. As its name suggests, this creates charts displaying exactly what starts during boot-up, and the time it takes. Once installed by Synaptic (search for the bootchart package), it runs as a background service and no configuration is necessary. After each boot you’ll find the chart it has generated in the /var/log/bootchart/ directory to view it, just precede its filename at the command-line with eog or browse to it using Nautilus and double-click it. The chart shows the total time taken to boot along the vertical axis, and beneath this shows the time taken by each of the startup services to complete. See an example taken from my test computer. Bootlog Graph Remember that programs such as Bootchart that log boot-up speeds can themselves impact performance. When you’ve finished with it, be sure to use Synaptic to remove the package.


